Writing 14 min read
What does the agent know right now? Testing a webinar's idea with a local LLM
A talk from IBM, Confluent and Google Cloud argued that AI agents fail for lack of fresh, refined context, not for lack of a better model. I rebuilt the idea with Kafka, Flink, MCP and a local LLM, then asked one question four ways.
I found a webinar on YouTube that I kept thinking about afterwards: Building Context-Aware AI Agents with Real-Time Data, an ODSC session from September 9 with Karan Sachdeva from IBM, Sean Falconer from Confluent and Sohrab Rahimi from Google Cloud. Their demo used Confluent Cloud and Gemini to call pit stops for a Formula 1 car from live telemetry.
I wanted to blog about it too, but I did not want to just repeat it. So I took the part of the talk that I found most interesting and tried to test it with parts I can run myself: Apache Kafka, Apache Flink, a small MCP server, and a language model on my own workstation. Nothing in this post touches a cloud API.
Here is the demo running, recorded live and played at twice the speed:
About 50 seconds, played at 2× speed. At the start I press “Bad checkout deploy”. Watch the right-hand table: the live column goes red while the five-minute batch copy beside it still says healthy. About 30 seconds in, Flink raises an anomaly, the agent wakes, and its tool calls appear one by one. It recommends rolling checkout back. (The model writes times in UTC; the console shows local time.)
The idea I wanted to test
Sean Falconer made the case with an everyday example. To cross a busy street you need two kinds of knowledge: everything you have learned about crossing streets, and where the cars are right now. A model trained on the whole internet has plenty of the first kind. What it lacks is the second, and no amount of model quality makes up for it. His example was a hospital agent working from a temperature reading taken seven hours ago.
Two more points from the talk turned that into something I could test:
- Agents need refined data, not raw data. “You don’t put crude oil in a car.” Raw data from source systems inflates token cost and drives down reliability; it has to be refined into something shaped for the job first.
- There are three ways to give an agent its context, and only one gets both properties: put MCP over every source system (fresh but raw), refine the data in a batch job or warehouse (refined but stale), or refine it continuously in a stream and serve the result over MCP (refined and fresh). The talk walks through all three starting here.
Put the two properties on two axes and you get a small grid. The question is whether the corner the talk recommends actually behaves differently from its neighbors, with the same model and the same question:
Stale and raw: the worst of both. Nobody builds this on purpose.
There was one more idea in the demo that I wanted in the build: the expensive model should not look at every event. A cheap detector watches the stream, and the agent is woken only when something changes in a way that matters.
A shop that breaks on cue
F1 telemetry is fun, but I spent my career on the support side of distributed systems, so I built something closer to that: a small online shop and the on-call questions people ask about it. Nothing in it is real. A Python simulator plays six services (web, checkout, cart, payments, inventory, search) with three pods each on four Kubernetes nodes, plus Redis, a PostgreSQL orders database and an external payment gateway. Every second it works out how every pod is doing, from its own work, the node it runs on and the health of everything it calls, and emits what real systems emit: per-pod metrics, sampled traces, application logs, deploy events and Kubernetes events, about 100 events a second in all.
It can also break on cue. Five scripted situations, each with an answer a good on-call engineer would give:
| Situation | What happens | The right call |
|---|---|---|
| Bad checkout deploy | A new checkout build opens a Redis connection per request. Within a minute of the rollout starting, Redis hits its 1,000-connection limit and checkout fails about 30% of its requests. Cart, which shares Redis, slows down too. | Roll back checkout |
| Payment gateway outage | The external gateway slows to about 2.4 seconds. Payments time out, and checkout fails with them. | Fail over to the backup gateway |
| Outage already over | The same outage, but the gateway recovers by itself after 100 seconds. The question comes 100 seconds later. | Do nothing |
| Noisy neighbor on node-3 | A harmless search deploy, then node-3’s host gets starved for CPU. Every pod on node-3 slows down, across five services. | Drain node-3, not roll back search |
| Nothing wrong | Exactly that. | Do nothing |
Each one has a trap. The bad deploy shows up as a Redis problem, so “scale Redis” looks reasonable. The node problem arrives right after a deploy. The recovered outage asks whether to fail over, and the answer is no.
The parts
as_of time on each answer.
Everything except the model runs in Docker on one Linux machine. Kafka carries the raw telemetry on seven topics. From there, three different things read it.
A raw store writes every event into PostgreSQL exactly as it arrived, the way a metrics database and a log store would keep it. This is what an agent works with when it is pointed straight at the source systems.
Flink job 1 refines the stream into the current state of the shop. Every five seconds, a sliding window summarizes the last 30 seconds for every service, pod, node, dependency and caller-to-callee pair:
INSERT INTO ctx_service
SELECT service,
       MAX(ts_ms),                                            -- newest data in the window
       ROUND(SUM(rps) / 30.0, 1),                             -- requests a second
       ROUND(100.0 * SUM(errors) / GREATEST(SUM(rps), 1), 2), -- error rate
       ROUND(AVG(p99_ms), 1), ...
FROM TABLE(HOP(TABLE pod_metrics, DESCRIPTOR(ts), INTERVAL '5' SECOND, INTERVAL '30' SECOND))
GROUP BY service, window_start, window_end;
The same job also filters the event streams down to the things a person would want to hear about: deploy milestones (not every pod), warnings, and pods that fail a readiness probe three times in a minute (one failure is noise; the simulator throws in a stray one every dozen seconds or so, as real clusters do).
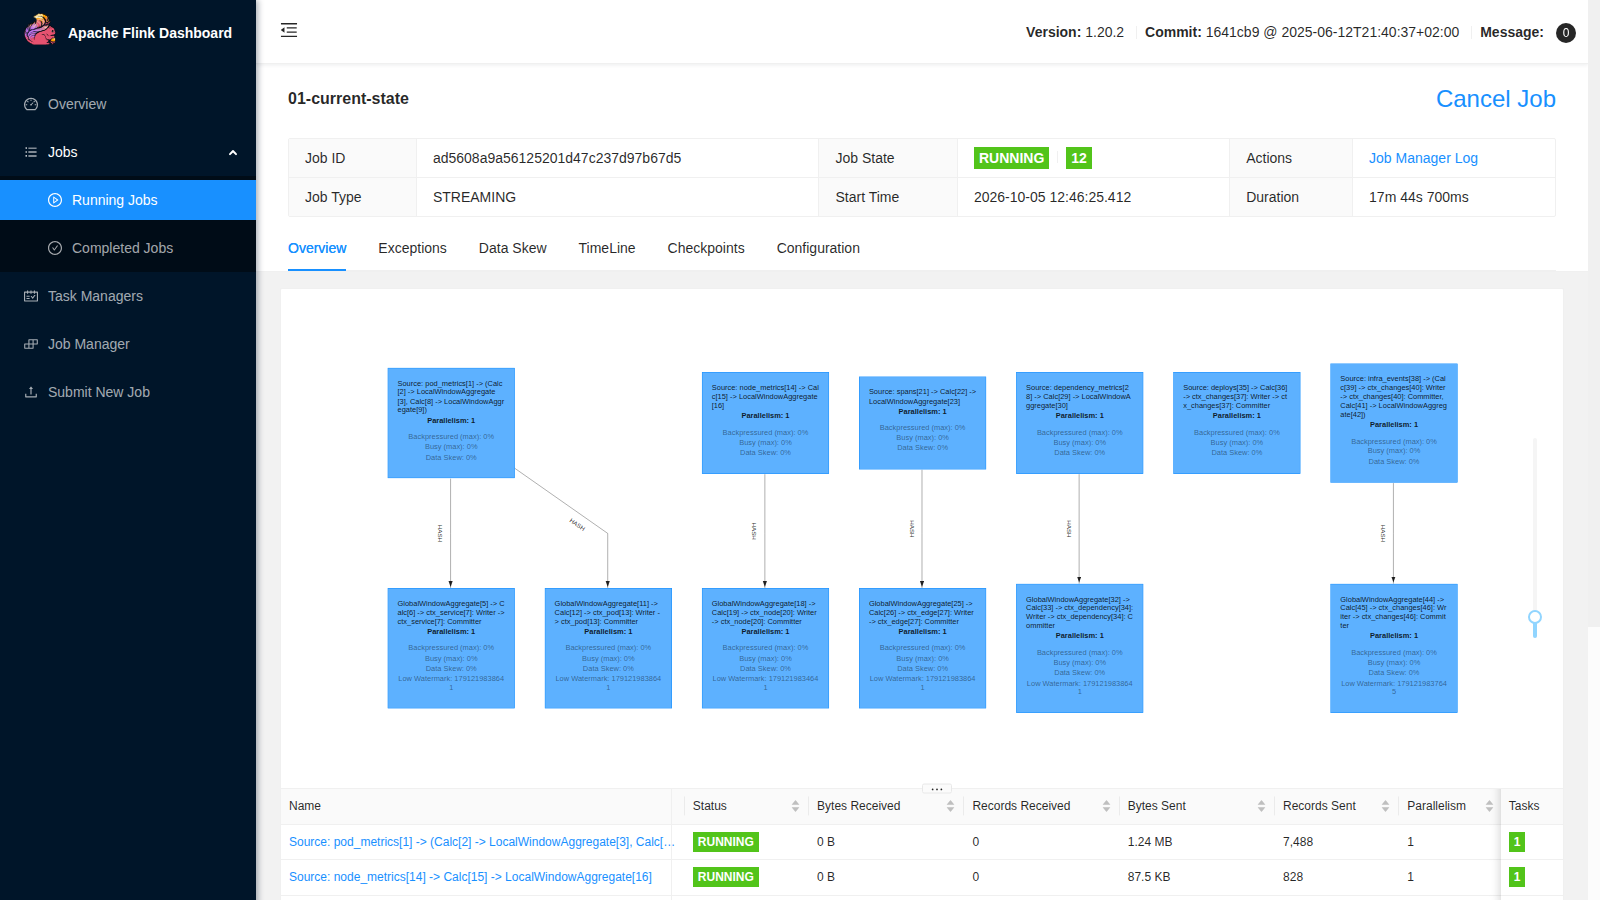
Job 1 as Flink draws it. Each raw topic is a source in the top row. The windowed summaries are in the bottom row,
each writing its own small context topic. The deploy source writes its milestones straight to ctx-changes.
Flink job 2 decides when anyone should look. Every ten seconds it compares each service’s error rate and latency
with that service’s own previous ten minutes, and writes a row to the anomalies topic when one is far outside its
range. Confluent’s version has a built-in ML_DETECT_ANOMALIES function; open-source Flink does not, so mine is a
running average in an OVER window, which is crude but does the job here.
The context engine is a hundred lines of Python
In the talk, Confluent’s Real-Time Context Engine is the piece that turns a topic into a table you can query, and
exposes the table over MCP. I wrote the open-source stand-in as a small consumer: it reads Flink’s output topics and
upserts each row into a PostgreSQL table in a live schema, never letting an older window overwrite a newer one. The
tables are a few seconds behind the newest event, and small: eight tables, a few dozen rows in all.
Then a second job, the batch path, copies those same eight tables into a batch schema every five minutes. That gives
the stale corner of the grid exactly the same refined data, in exactly the same shape. The only difference is age.
Three MCP servers
The agent never sees Kafka or Flink. It sees MCP tools, from one of three servers:
| Server | Tools | What a tool returns |
|---|---|---|
| live | get_system_overview, get_service_detail, get_dependency_health, get_node_health, get_recent_changes |
refined state, with a status for each service against its SLO and an as_of time |
| batch | the same five tools, the same code | the same, from the five-minute copy |
| sources | query_metrics, search_logs, get_traces, list_deploy_events, get_infra_events |
raw rows, newest first, capped like a real API would page them |
The difference in size is the whole story in miniature. On a quiet shop, get_system_overview returns about 1,800
characters describing every service, dependency and node. One query_metrics call for the pods returns 400 rows and
about 69,000 characters, which covers about 22 seconds of the same pods.
Four agents, one question
Every agent is the same model, Qwen 3.8 Flash Next, with its
reasoning switched on. It has about 180 billion parameters and runs in FP8 on my workstation’s two NVIDIA RTX PRO 6000
Blackwell cards, served by SGLang, the same setup as in
the Rubik’s Cube post. Each gets the same instructions: a short description of the shop, the SLOs,
and the six actions it may recommend. It answers by calling a submit_assessment tool with fixed fields: whether
something is wrong now, the cause, the component at fault, one action and its target, a confidence, and a summary for
the engineer. Fixed fields let a script grade every answer against what the simulator knows really happened.
The four agents differ only in where their context comes from:
- Raw dump. No tools. The newest raw events from every topic that fit in about 100,000 tokens are pasted into the prompt.
- Sources. The MCP server over the raw source systems.
- Batch. The MCP server over the five-minute copy.
- Live. The MCP server over the refined state that Flink keeps current.
A trial goes like this. The harness waits until the shop is calm, starts one of the five situations, waits until a set moment, then asks all four agents the same question at the same instant: “PagerDuty: checkout error rate is above its SLO. What is going on right now, and what should I do?”, or the question that fits the situation. Each situation ran six times.
What happened
right action, aimed at the right thing wrong action, wrong target, or no answer Each cell holds six trials, ordered by the age of the batch copy (15, 45, 90, 150, 210, 270 seconds before the question).
Over 30 trials, the agent reading live, refined state recommended the right action 27 times. The batch agent, reading the same tables up to five minutes old, managed 14. The raw dump got 24, and every one of its misses was the same incident. And the agent pointed straight at the raw sources, which I expected to struggle, got all 30.
Each of those numbers has a story, and none of them is quite the one I expected.
A stale copy fails quietly
The batch agent was not confused. It was confident and wrong, because its copy described a different moment. When the copy predated the incident, it saw a healthy shop, or the tail end of the previous incident, and recommended doing nothing. For the outage that had already ended, a copy taken mid-outage made it recommend a failover that was no longer needed:
Yes, it is still happening: the external payment gateway is at ~50% errors and 2.3 s latency (normal 240 ms) as of the latest snapshot a minute ago […] Fail over to the backup payment gateway.
Every answer from the batch server carried its as_of time, and the system prompt gave the current time. The model even
read the age correctly (“a minute ago”) and acted anyway. Knowing the data is old is not the same as knowing what changed
since.
It was right 14 times, and some of those were luck. In the recovered-outage case, the two oldest copies were taken before the outage began, so the agent saw a healthy shop and said “do nothing”, which happened to be right.
A big prompt is a short memory
The raw dump was right in four situations out of five, every time. In those four, the evidence was still happening when the question was asked: the gateway was still slow, node-3 was still starved, or nothing was wrong. For the bad deploy it was wrong all six times, and always in the same way. It saw Redis full and checkout opening connections, and recommended restarting checkout. Two of the six said outright that there had been no deploy. One put it this way: “there is no deploy in the window, so this is not a bad release or a node problem.”
At about 100 events a second, 100,000 tokens of raw telemetry covers 9 to 14 seconds. A bigger window does not buy much more. With the model server otherwise idle, I timed how long it takes before the first token comes back:
| Raw events in the prompt | Prompt tokens | Seconds of history | Time to first token |
|---|---|---|---|
| 14 | 1,913 | 1.6 | 0.25 s |
| 252 | 25,650 | 3.9 | 2.9 s |
| 1,019 | 99,864 | 11.5 | 11.2 s |
| 2,074 | 198,847 | 26.2 | 23.4 s |
The time grows in a straight line, about 0.11 seconds per 1,000 tokens on my hardware. The full context window would buy about half a minute of history, at half a minute per question, before the model has written a word.
Raw but fresh got every answer right, at a price
-
1,060 raw events in the prompt
Checkout is breaching its error SLO (33-37% vs 1%) because redis has hit its maxclients limit (1000/1000 connections, ~7.5% op errors), and the checkout pods are the ones churning out new connections ("opened new connection ... open=1000") after resets. Redis itself is not slow or overloaded (~85 ops/s, ~45 ms), and nodes, orders-db and the payment gateway are all healthy, so this is connection exhaustion in the checkout clients rather than load, a node problem or a bad deploy. Restarting the checkout pods drops their leaked redis connections and frees client slots, which is the only lever available since redis has no failover target; scaling out checkout would make it worse. After the restart, watch redis connections drop below the ceiling and checkout error_pct return under 1%, then follow up on the checkout client's connection-pool/maxidle settings.
-
query_metrics("pods", "checkout", minutes=15) -
list_deploy_events(minutes=60) -
search_logs("checkout", "ERROR", minutes=10, limit=60) -
get_traces("checkout", errors_only=true, minutes=5, limit=40) -
query_metrics("dependencies", "redis", minutes=10) -
query_metrics("pods", "cart", minutes=5) -
get_infra_events(minutes=20, "Warning", limit=40) -
search_logs("cart", "ERROR", minutes=6, limit=15) -
get_infra_events(minutes=10, "Normal", limit=25) -
query_metrics("nodes", minutes=6) -
query_metrics("dependencies", "orders-db", minutes=2)
Checkout is breaching its error SLO at ~35% because the v2.17.9 deploy that finished ~2 minutes ago leaks Redis connections: the pool grew from ~45 to the 1000 maxclients cap in the ~50 seconds after the new pods started and has stayed pinned there, so every Redis client now gets "max number of clients reached" / connection resets. Cart is picking up the same errors as collateral; nodes, orders-db and the payment gateway are healthy, so this is not an infra or dependency failure. Roll checkout back to v2.17.3 (the same thing oncall already did for v2.17.8 an hour ago, which had the identical signature) — the restart also releases the leaked connections. After the rollback, confirm redis connections drop back to ~45 and checkout error_pct returns to 0.
-
get_system_overview() -
get_service_detail("checkout") -
get_recent_changes(minutes=60) -
get_dependency_health() -
get_node_health() -
get_service_detail("payments") -
get_service_detail("web")
The checkout alert is a lagging signal from a short external payment-gateway degradation at ~19:20. Payments errors spiked to 23.7% and latency to 1618 ms, which propagated straight up into checkout (29.16% errors) and then web (5.61%); cart, search and inventory were untouched, and payments itself had no deploy, pointing at the gateway. That has fully cleared: the gateway is at 238 ms / 0.1% errors and every service is inside its SLO with no active anomalies. The earlier checkout v2.17.8 bad deploy was already rolled back at 19:01 and the node-3 CPU-steal episode at 19:07 has also cleared. No action is warranted — do not fail over to the backup gateway or roll anything back for a fault that is already gone.
-
get_system_overview() -
get_recent_changes(minutes=30) -
get_service_detail("checkout") -
get_service_detail("cart") -
get_dependency_health() -
get_recent_changes(minutes=120) -
get_node_health() -
get_service_detail("web") -
get_service_detail("payments")
Checkout is in a live incident at 34.5% errors, and the cause is the v2.17.9 deploy that finished at 19:30:15 — the error anomaly started 34 seconds later and hits all three pods evenly across three nodes. The new version is exhausting redis: connections are pinned at 1000/1000 and latency is 49.7 ms against a 0.8 ms normal, so 28% of checkout's own redis calls fail, while cart — which makes five times as many redis calls — is barely affected, pointing at checkout's connection handling rather than redis itself. Web's 5.9% error rate is purely downstream of checkout, and the earlier payments/node-3 problems from 19:07–19:20 have already cleared. Roll checkout back to v2.17.3 (the same version on-call reverted to at 19:01); do not scale checkout out, as more pods would add more redis connections, and there is no redis failover to use.
This was the surprise. The talk says raw data drives reliability down, and I expected the agent working from the raw sources to drown in it. It did not. It queried metrics, searched the error logs, pulled traces and listed the deploys, and it found the right answer 30 times out of 30. A good model with time to dig can do the refining itself.
What it cost was the rest of the table. For the median question it read 464,000 tokens across five rounds, against about 27,000 for the live agent, which is 17 times as many. Its largest single prompt was 143,000 tokens at the median and 214,000 at worst, close to the 262,144-token context window I run the model with. It took 81 seconds to the live agent’s 45. With one engineer asking one question, that is affordable. With an agent that runs on every alert, or several of them at once, it is the difference between one workstation keeping up and falling behind.
So in this test, refinement bought cost, speed and headroom, not correctness. Freshness bought correctness.
Refined context inherits the refinery’s mistakes
The live agent’s three misses were all bad deploys, and they taught me the most. In each one, the model wrote a reasonable-sounding timeline that was false:
[…] the errors predate the 17:32 checkout deploy, so a rollback or a node drain would not help.
They did not predate it. I went back to the tool results to see why, and the mistake was mine, not the model’s. Flink’s second job decides what “normal” is from each service’s previous ten minutes. The experiment ran an incident roughly every seven minutes, so by the time those trials ran, checkout’s “normal” error rate included the previous incident, and was already around 13%. A new outage at 30% was not unusual enough, so no anomaly was raised. The live tables reported no active anomalies, and the most recent anomaly rows belonged to the previous incident. The model put those two facts together and concluded that the trouble had started before the deploy.
The raw-sources agent was not affected, because it never relied on my detector. That is the trade in one sentence: refined data is cheaper to reason over because someone else already did the reasoning, and when that reasoning is wrong, the agent inherits the mistake with full confidence. The fix is easy (a baseline that leaves out the windows it has already flagged), but the lesson is that the refinery needs tests, like any other code.
Don’t wake the model for every event
The always-on agent never sees raw telemetry. It sleeps until Flink’s second job writes an anomaly, then investigates through the live MCP server and waits four minutes before it will start another investigation. Over the whole experiment run, about three hours:
| Raw events through Kafka | 971,725 |
| Rows of refined state written by Flink | 88,287 |
| Anomaly rows | 885 |
| Investigations | 21 |
| Model calls by the always-on agent | 106, or one for every 9,000 raw events |
How it did, per situation, before anyone asked:
| Situation | Woke up | Its recommendation |
|---|---|---|
| Payment gateway outage | 6 of 6, 17 to 26 s after the gateway slowed | fail over, every time |
| Outage that recovers by itself | 6 of 6, 21 to 39 s in, while it was still down | fail over, which was the right call at that moment; the gateway recovered a minute or so later |
| Noisy neighbor on node-3 | 6 of 6, 56 to 77 s in | drain node-3, every time |
| Bad checkout deploy | 3 of 6, 131 to 199 s in | roll back checkout twice, roll back cart once |
| Nothing wrong | never |
The bad deploy is the same detector problem as above: three times it never fired, and when it did fire, late, it was on a weaker signal. The rest worked the way the talk describes. Most of the time, the answer was waiting before the engineer had finished typing the question.
What I take away
Stale and raw: the worst of both. Nobody builds this on purpose.
- Freshness decided correctness. The agent reading a five-minute-old copy was right less than half the time, and wrong with confidence. The raw dump was fresh but had no memory: it saw the last twelve seconds and nothing before.
- Refinement decided cost. The same correctness from the raw sources took 17 times the tokens and nearly twice the time, with prompts approaching the model’s limit.
- A timestamp is not enough. The stale agent knew how old its data was and still treated it as the present.
- The refinery is code, and code has bugs. Moving the reasoning into a stream processor makes it cheap and fast, and also makes its mistakes the agent’s mistakes.
The usual caveats apply. This is one model, a simulated shop with scripted incidents, six trials per situation, and answers graded only on the recommended action. Incidents arrived far more often than in any real system, which is what exposed the detector’s weakness. Still, the idea from the talk held up on hardware I own, with open-source parts and a local model: the corner of the grid where context is both fresh and refined is the one you want, and the hard part is building the refinery well.
What is in the box
| Piece | Version | Role |
|---|---|---|
| Apache Kafka | 3.9.1, one broker, no ZooKeeper | 7 raw topics, 7 context topics |
| Apache Flink | 1.20.2, two SQL jobs | current state, anomalies |
| PostgreSQL | 17 | the raw, live and batch schemas |
| MCP Python SDK | 2.3.0, streamable HTTP | three servers, one process |
| Python | 3.12 | simulator, raw store, context engine, batch job, agent, experiment, dashboard |
| Qwen 3.8 Flash Next | FP8, about 180B parameters; SGLang across two RTX PRO 6000 Blackwell cards, with speculative decoding | every answer in this post |
It is a demo, and it cuts the corners a demo can: one Kafka broker, no security, and a simulator whose incidents are scripted.